Dashboard
The Dashboard is a powerful in-game profiler and control panel. It allows you to monitor the plugin's operation, analyze frame timings, and manually override Scaler levels directly within a running build.
How to Use
Drag and drop the Dashboard.prefab into any scene in your project.
It automatically sets itself to DontDestroyOnLoad and remains accessible during scene transitions.
Note for Production Builds
The Dashboard is completely decoupled from the plugin core. Before publishing your game, simply delete the prefab from the scene. Unity's Code Stripping system will automatically remove all dashboard code from the final build (avoiding Resources folder bloat), preserving minimal project weight. The WebAP core will continue running in the background.
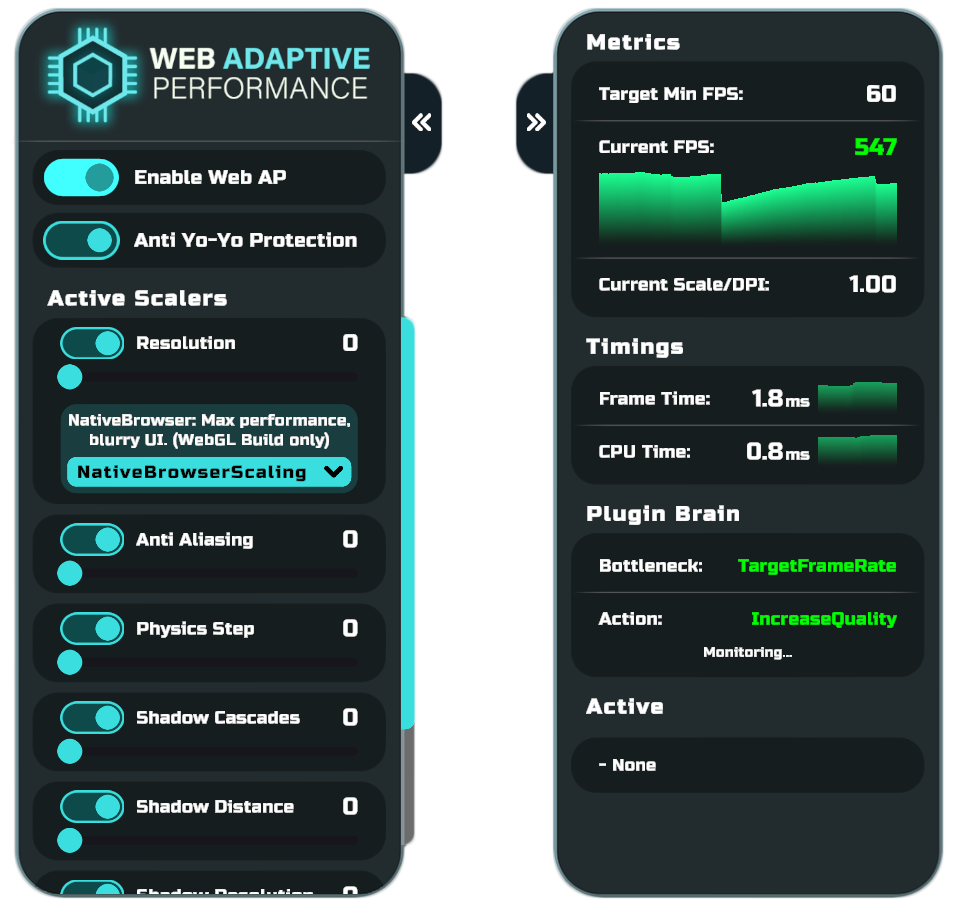
Left Panel (Control)
The left side of the Dashboard is designed for real-time interaction with the plugin.
- Enable Web AP
The global toggle for the plugin core. If disabled, automatic optimization stops, and all graphics parameters revert to their original (maximum) values. - Anti Yo-Yo Protection
Enables or disables the Penalty Lockout. If disabled, the plugin can increase and decrease graphics without temporary blocks.
(See details: Anti Yo-Yo System) - Active Scalers
A list of all optimization modules added to the system.- Toggle: Dynamically enable or completely disable a specific Scaler.
- Slider: Manual override of the quality level (
Override Level). A value of0means maximum quality. If you move the slider, the Indexer stops managing this Scaler, allowing you to visually assess its impact on the game. - Resolution Mode: An exclusive setting for the
Resolution Scaler(in BiRP mode). Allows on-the-fly switching betweenNativeBrowserScalingandRenderTextureScalingstrategies.
(See details: Scalers Reference)
Right Panel (Analytics)
The right side displays raw engine metrics and the internal logic of the plugin's "brain". A Zero-GC Exponential Moving Average algorithm is utilized to smooth the graphs.
Metrics & Timings
- Target Min FPS: The baseline performance target retrieved from your Project Settings.
- Current FPS: The current frame rate with a historical spike graph.
- Current Scale / DPI: The current resolution multiplier.
1.00denotes native resolution. Lower values (e.g.,0.50) indicate the 3D world resolution is reduced to save GPU. - Frame Time / CPU Time: Precise hardware timings gathered via
FrameTimingManager. They help comprehend how much real time the CPU spends on frame logic.
Plugin Brain
Displays the decision pipeline logic.
(See details: How it Works)
- Bottleneck: Identifies which device subsystem is currently lagging (
CPU,GPU,TargetFrameRate, orUnknown). - Action: Indicates what the Indexer intends to do (
IncreaseQuality,DecreaseQuality, orStale— if no action is required). - Status (under Action): System state:
Monitoring...(evaluating the frame),Cooldown(waiting for stabilization after a graphics change), orPenalty Lockout(the Anti Yo-Yo penalty is active).
Active
- A list of Scalers whose levels are currently reduced by the system to save performance. If the FPS is high and everything is optimal, this will display
- None.